 Remote debugging is the process of debugging a program running on a different system (called target) from a different system (called host).
To start remote debugging, a debugger running on host machine connects to a program which is running on the target via network.
The debugger in the host can then control the execution of the program on the remote system and retrieve information about its state.
Remote debugging is often useful in case of embedded applications where the resources are limited.
In this tutorial, we will see how we can debug programs running on a different system using GDB Server.
If you are new to GDB, you should first understand how to use GDB to debug C program.
We need the following two utilities to perform a remote debugging.
- gdbserver – Run this on your target system
- GDB – Execute this on your host system to connect to your target system
GDB and gdbserver communicate via either a serial line or a network, using the standard gdb remote serial protocol.
1. Install gbdserver on Target System
Target machine is the one which is running the program which you have to debug. You need to have the “gdbserver” executable on the target machine.
$ sudo apt-get install gdbserver
To do remote debugging, start your program using the gdbserver. gdbserver then automatically suspends the execution of your program at its entry point, and it waits for a debugger to connect to it. gdbserver doesn’t need the symbols from your program to debug. So you can strip symbols out of your program binary to save space.
$ gdbserver localhost:2000 my_prg

Process program created; pid = 2045
Listening on port 2000
The above command suspend the execution on my_prg, and waits for a debugger to connect to it on port 2000.
2. Launch gdb on Host System
The executable file and the libraries in the host, must exactly match the executable file and libraries on the target, with an exception that the target binary symbols can be stripped. You can also load the symbols separately in the host using “file” command in gdb.
Run GDB on the host.
$ gdb my_prg
(gdb)
Use “target remote” to connect to the target system.
(gdb) target remote 192.168.1.10:2000
Now you can run the normal gdb commands, as if you are debugging a local gdb program.
3. Remote Debugging Demo Example
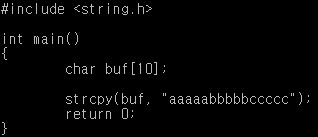
The following C program example will be used to demonstrate the remote debugging.
#include <stdio.h>

int power(int,int);

int main() {

        int i;
        printf("Program to calculate power\n");
        for (i=0;i<10;i++)
                printf("%d %d\n",i, power(2,i));
        return 0;
}

int power (int base, int n) {

        int i,p;
        p=1;
        for (i=1; i<=n; i++)
                p = p*base;
        return p;
}

$ cc -g -o my_prg power.c
On Target Machine,
$ gdbserver localhost:2000 my_prg
Process my_prg created; pid = 20624
Listening on port 2000
On Host Machine,
$ gdb my_prg

(gdb) target remote 192.168.1.10:2000
Remote debugging using 192.168.1.10:2000
Loaded symbols for /lib64/ld-linux-x86-64.so.2
0x00007ffff7dddaf0 in ?? () from /lib64/ld-linux-x86-64.so.2
(gdb) b main
Breakpoint 1 at 0x400550
(gdb) continue
Continuing.

Breakpoint 1, 0x0000000000400550 in main ()
Now we have connected the gdb for remote debugging. In the last example, we have put a breakpoint in main() function. If we continue our program, the output of the program will be printed in the target machine.
On Host:
(gdb) continue
On Target:
Remote debugging from host 192.168.1.20
Program to calculate power
0 1
1 2
2 4
3 8
4 16
5 32
6 64
7 128
8 256
9 512

Child exited with status 0
GDBserver exiting
4. Attach gdb to a Running Process on Target
First you have to find the process ID of the running process in target.
On Host,
(gdb) attach 3850
Now the gdb will suspend the process 3850 in the target and you can debug the program using normal gdb commands.
5. Launch gdbserver in Multi-process Mode
In the previous demo, you would have noticed that once the program executed successfully, the gdbserver also got exited. In real-time, you may want to debug multiple programs remotely, and you may not want to start the gdbserver every time with different program names. Do the following to achieve that.
On Target, run the gdbserver with –multi and without a program name.
$ gdbserver --multi localhost:2000
Listening on port 2000
On Host,
$ gdb

(gdb) target extended-remote 192.168.1.10:2000
Remote debugging using 192.168.1.10:2000

(gdb) (gdb) set remote exec-file /my_prg
(gdb) file /my_prg
Reading symbols from /my_prg...(no debugging symbols found)...done.
(gdb) b main
Note: breakpoint 1 also set at pc 0x400550.
Breakpoint 2 at 0x400550
(gdb) run
Starting program: /my_prg
Breakpoint 1, 0x0000000000400550 in main ()
From the above snippet,
- ‘target extended-remote’ is used to run gdbserver in multi process mode.
- ‘set remote exec-file /my_prg’ is used to set the program which you want to debug in the target.
- ‘file /my_prg’ is used to load the debugging symbols from the program in the host.
- ‘b main’ is used to set breakpoint at main() function.
- ‘run’ is used to run the program, which stops at the breakpoint main().
Note: In the above case, the executable “my_prg” is present under “/” on both target and host.
Now either you can ‘continue’ or ‘detach’ the program from debugging. Still the gdbserver will not exit in the target machine, so you can change the ‘remote exec-file’ at any time, and debug a different set of program.
Debugging C/C++ Programs Remotely Using Visual Studio Code and gdbserver
If you’re like me and prefer using a GUI to a command line for setting breakpoints, stepping through code, and inspecting values as your program runs, here is how you can set up VSCode and gdbserver to edit and debug your code locally while running it on a remote server.
Background: I’m working on an assignment for CSC469 at the University of Toronto, and it will only compile and run on the university’s teaching lab machines. My goal was to be able to edit and debug locally in a familiar editor while compiling and running on the remote teaching lab machines.
Note: I’m using macOS Sierra locally, with the remote machine running Ubuntu 14.04, but this guide should work with any Unix system. (Sorry, Windows users).
Note: Commands to be run on the remote machine are prefixed with remote$and local commands are prefixed with local$ .
1. Install gdbserver on the remote machine
Installation varies by system. On Debian/Ubuntu, you can do:
remote$ apt-get install gdbserver
Since students are not allowed to install software via apt on the U of T machines, I used Linuxbrew to install it to my user folder:
remote$ brew install gdbserver
2. Install gdb on your local machine
On macOS Sierra, I used Homebrew to install gdb:
local$ brew install gdb --with-all-targets
Note: The --with-all-targets option is important; without it, you won’t be able to debug on a remote machine with a different OS or architecture than your local machine.
3. Test gdb
At this point, you should be able to run gdbserver on the remote machine and connect to it from your local gdb CLI. I’ll use the -L option of ssh to forward local port 9091 connections to the remote port 9091:
local$ ssh -L9091:localhost:9091 user@remote
remote$ cd ./myproject/ && make
remote$ gdbserver :9091 ./myprogram
(Port 9091 is arbitrary; use any port number you like)
Leave that command running in a terminal window; it will wait until gdb connects before running ./myprogram .
In another terminal window on your local machine, run gdb:
local$ gdb
GNU gdb (GDB) 7.12
Copyright (C) 2016 Free Software Foundation, Inc.
...
For help, type "help".
Type "apropos word" to search for commands related to "word".
(gdb)
Then connect to the gdbserver instance:
(gdb) target remote localhost:9091
Remote debugging using localhost:9091
...
(gdb)
To verify things are working, you can run various gdb commands like info sources , or set a breakpoint with break . Use continue to run ./myprogram .
4. codesign gdb
VSCode prevents you from running gdb unless it’s signed; follow these steps to ensure it’s signed.
5. Synchronize local and remote file systems
You may have noticed that, for basic functionality, the gdb CLI on your local machine doesn’t need to be provided any information about the program or its source code except for the host and port on which gdbserver is running. But there are two big reasons why you’ll want to keep your local and remote project directories in sync:
- Viewing source code in the gdb CLI (i.e.
list).
- The VSCode C/C++ extension requires you to provide the path to the compiled executable to launch gdb. (The
"program" field in launch.json).
I opted to use sshfs since it required the least server-side setup, but you could use NFS, rsync, or other alternatives.
Using sshfs, mount the remote project folder locally:
local$ mkdir ./myproject
local$ sshfs user@remote:myproject ./myproject
Note: on macOS, you can later unmount the directory with umount ./myproject. On Linux, use fusermount -u ./myproject.
6. Configure Visual Studio Code
Open your newly-mounted project ./myproject/ in VSCode, then open .vscode/launch.json or create it if it doesn’t exist:
{
  "version": "0.2.0",
  "configurations": [
    {
      "name": "C++ Launch",
      "type": "cppdbg",
      "request": "launch",
      "program": "${workspaceRoot}/myprogram",
      "miDebuggerServerAddress": "localhost:9091",
      "args": [],
      "stopAtEntry": false,
      "cwd": "${workspaceRoot}",
      "environment": [],
      "externalConsole": true,
      "linux": {
        "MIMode": "gdb"
      },
      "osx": {
        "MIMode": "gdb"
      },
      "windows": {
        "MIMode": "gdb"
      }
    }
  ]
}
This configuration will make it so clicking “C++ Launch” will run gdb similar to:
local$ gdb ./myprogram
...
(gdb) target remote localhost:9091
7. Write a script to compile your program and launch gdbserver
Ideally, you’d want to be able to run a single command or click a single button to compile & debug your program.
This might be possible to do via VSCode tasks and the preLaunchTask option in launch.json, but I was not able to put together a simple solution using those.
Instead I wrote a quick-and-dirty shell script prepare_remote_debug.sh :
# Kill gdbserver if it's running
ssh user@remote killall gdbserver &> /dev/null
# Compile myprogram and launch gdbserver, listening on port 9091
ssh \
  -L9091:localhost:9091 \
  user@remote \
  "zsh -l -c 'cd myproject && make && gdbserver :9091 ./myprogram'"
8. Start debugging
Here is your new workflow:
- Edit some code.
- Run
./prepare_remote_debug.sh in a terminal window. Your program’s output will appear here.
- Set some breakpoints.
- Run “C++ Launch”.
- Step through your code in VSCode’s debugger.
- Repeat.
That’s it! I hope this helps someone, and let me know if it can be simplified even further.
C/C++ for VS Code (Preview)
C/C++ support for Visual Studio Code is provided by a Microsoft C/C++ extension to enable cross-platform C and C++ development using VS Code on Windows, Linux, and macOS. The extension is still in preview and our focus is code editing, navigation, and debugging support for C and C++ code everywhere that VS Code runs.
If you just want a lightweight tool to edit your C++ files, Visual Studio Code is a great choice but if you want the best possible experience for your existing Visual C++ projects or debugging on Windows, we recommend you use a version of Visual Studio such as Visual Studio Community.
If you run into any issues or have suggestions for the Microsoft C/C++ extension, please file issues and suggestions on GitHub. If you haven’t already provided feedback, please take this quick survey to help shape this extension for your needs.
Note for Linux users: The C/C++ extension works on 64-bit Linux distros that have glibc 2.18 or later installed.
Getting Started
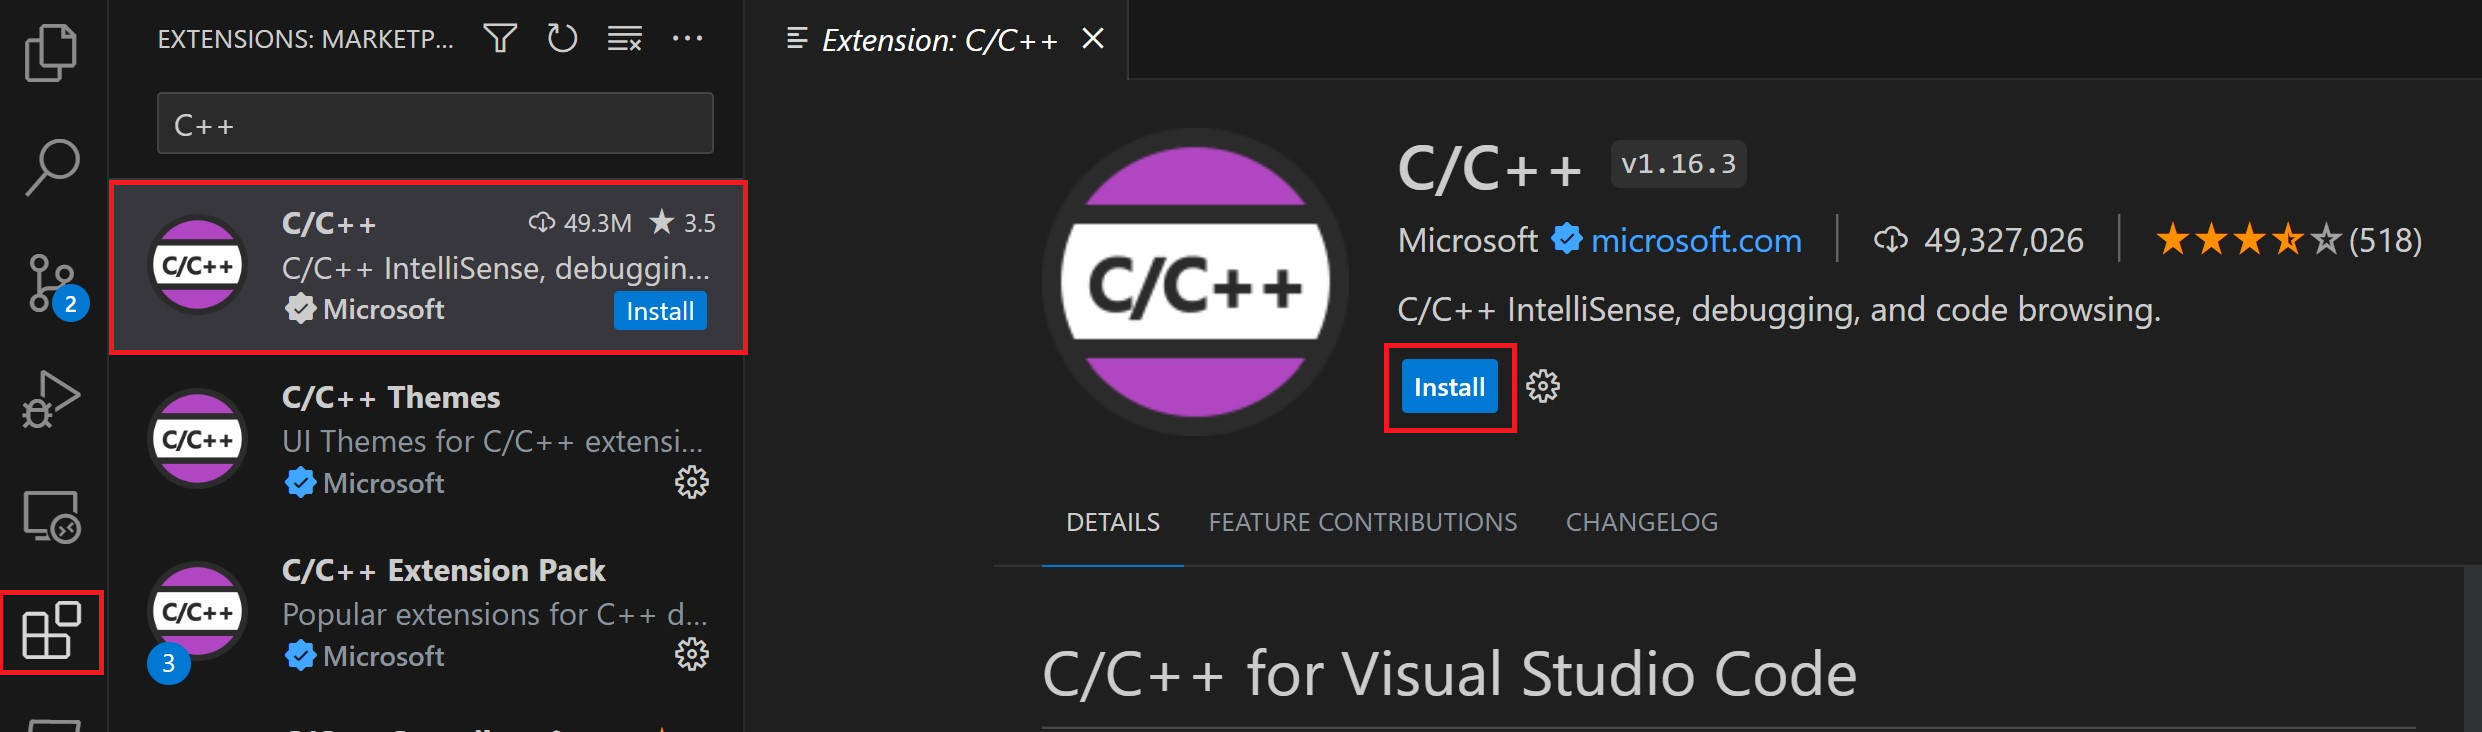
To install the Microsoft C/C++ extension:
- Open VS Code.
- Click the Extensions View icon on the Sidebar.
- Search for
c++.
- Click Install, then click Reload.
With the C/C++ extension installed, open a folder that contains your C/C++ source code. VS Code will place various settings files into a .vscode subfolder.
Note: The C/C++ extension does not include a C++ compiler or debugger. You will need to install these tools or use those already installed on your computer. Popular C++ compilers are MinGW for Windows, XCode for macOS, and GCC on Linux. Also make sure your compiler executable is on your platform path for VS Code to find.
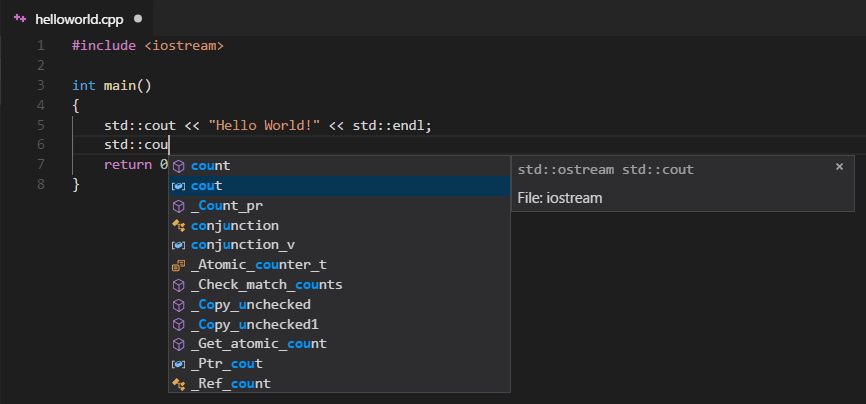
IntelliSense
To enable code completion and navigation, you will need to generate a c_cpp_properties.json file:
- Find any green squiggle in a source file (for example, an #include statement) and set the cursor on the line.
- Click the lightbulb that appears in the left gutter.
- Click Update “browse.path” setting.
This will generate a c_cpp_properties.json file that allows you to add additional browse paths to properly enable code navigation and auto-completion. The generated c_cpp_properties.json file has sections for different operating systems, make sure you update the appropriate settings for your current platform.
Below you can see that the MinGW C++ include path has been added to browse.path for Windows:
{
    "name": "Win32",
    "includePath": [
        "${workspaceFolder}"
    ],
    "defines": [
        "_DEBUG",
        "UNICODE"
    ],
    "intelliSenseMode": "msvc-x64",
    "browse": {
        "path": [
            "${workspaceFolder}",
            "C:\\MinGW\\lib\\gcc\\mingw32\\6.3.0\\include\\c++"
        ],
        "limitSymbolsToIncludedHeaders": true,
        "databaseFilename": ""
    }
}
Note: You can also generate or edit a c_cpp_properties.json file with the C/Cpp: Edit Configurations command from the Command Palette (Ctrl+Shift+P).
Building your code
If you want to build your application from VS Code, you will need to generate a tasks.json file:
- Open the Command Palette (Ctrl+Shift+P).
- Select the Tasks: Configure Tasks… command, click Create tasks.json file from templates, and you will see a list of task runner templates.
- Select Others to create a task which runs an external command.
- Change the
command to the command line expression you use to build your application (for example g++).
- Add any required args (for example
-g to build for debugging).
- You can also change the
label to be more descriptive.
You should now see a tasks.json file in your workspace .vscode folder that looks something like:
{
    "version": "2.0.0",
    "tasks": [
        {
            "label": "build hello world",
            "type": "shell",
            "command": "g++",
            "args": [
                "-g", "helloworld.cpp"
            ]
        }
    ]
}
If you’d like to be able to build your application with Tasks: Run Build Task (Ctrl+Shift+B), you can add it to the build group.
{
    "version": "2.0.0",
    "tasks": [
        {
            "label": "build hello world",
            "type": "shell",
            "command": "g++",
            "args": [
                "-g", "helloworld.cpp"
            ],
            "group": {
                "kind": "build",
                "isDefault": true
            }
        }
    ]
}
For more information on tasks, see Integrate with External Tools via Tasks.
Debugging your code
To enable debugging, you will need to generate a launch.json file:
- Navigate to the Debug view by clicking the Debug icon in the Sidebar.
- In the Debug view, click the Configure icon.
- Select
C++ (GDB/LLDB) (to use GDB or LLDB) or C++ (Windows) (to use the Visual Studio Windows Debugger) from the Select Environment dropdown. This creates a launch.json file for editing with two configurations:
- C++ Launch defines the properties for launching your application when you start debugging.
- C++ Attach defines the properties for attaching to a process that’s already running.
- Update the
program property with the path to the program you are debugging.
- If you want your application to build when you start debugging, add a
preLaunchTask property with the name of the build task you created in tasks.json (“build hello world” in the example above).
Below is an example using the MinGW GDB debugger:
{
    "version": "0.2.0",
    "configurations": [
        {
            "name": "(gdb) Launch",
            "type": "cppdbg",
            "request": "launch",
            "program": "${workspaceFolder}/a.exe",
            "args": [],
            "stopAtEntry": false,
            "cwd": "${workspaceFolder}",
            "environment": [],
            "externalConsole": true,
            "MIMode": "gdb",
            "miDebuggerPath": "C:\\mingw\\bin\\gdb.exe",
            "setupCommands": [
                {
                    "description": "Enable pretty-printing for gdb",
                    "text": "-enable-pretty-printing",
                    "ignoreFailures": true
                }
            ],
            "preLaunchTask": "build hello world"
        }
    ]
}
To learn more, see Configuring launch.json for C/C++ debugging.
If you are debugging with GDB on Windows, see Windows Debugging with GDB.
Editing Code
The C/C++ extension for Visual Studio Code supports source code formatting using clang-format which is included with the extension.
You can format an entire file with Format Document (Shift+Alt+F) or just the current selection with Format Selection (Ctrl+K Ctrl+F) in right-click context menu. You can also configure auto-formatting with the following settings:
C_Cpp.clang_format_formatOnSave – to format when you save your file.editor.formatOnType – to format as you type (triggered on the ; character).
By default, the clang-format style is set to “file” which means it looks for a .clang-format file inside your workspace. If the .clang-format file is found, formatting is applied according to the settings specified in the file. If no .clang-format file is found in your workspace, formatting is applied based on a default style specified in the C_Cpp.clang_format_fallbackStyle setting instead. Currently, the default formatting style is “Visual Studio”. Using “Visual Studio” formatting ensures that source code formatting will be compatible in both VS Code and Visual Studio Community.
The “Visual Studio” clang-format style is not yet an official OOTB clang-format style but it implies the following clang-format settings:
UseTab: (VS Code current setting)
IndentWidth: (VS Code current setting)
BreakBeforeBraces: AllMan
AllowShortIfStatementsOnASingleLine: false
IndentCaseLabels: false
ColumnLimit: 0
If you’d like to use a different version of clang-format than the one that ships with the extension, you can use the C_Cpp.clang_format_path setting and set its value to the path where the clang-format binary is installed.
For example on the Windows platform:
"C_Cpp.clang_format_path": "C:\\Program Files (x86)\\LLVM\\bin\\clang-format.exe"
Fuzzy Auto-Complete
Fuzzy auto-complete is powered by an enhanced tag-parser approach. Although suggestions are not based on semantic analysis of your code, this feature provides a wider selection of matches than the single-file IntelliSense experience provided today.
In particular, this feature’s capabilities give a good experience for C code.
Navigating Code
The source code navigation features provided by the C/C++ extension are powerful tools for understanding and getting around in your codebase. These features are powered by tags stored in an offline database of symbol information. With the C/C++ extension installed, this database is generated whenever a folder containing C++ source code files is loaded into VS Code. The platform indicator (Win32 in the figure below) turns red and appears next to a flame icon while the tag-parser is generating this information.

When the platform indicator returns to its normal appearance, the source code symbols have been tagged in the offline database and source code navigation features are ready to be used.
Specifying Additional Include Directories for Better Symbol Support
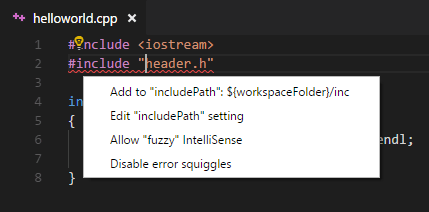
To provide the best experience, the C/C++ extension for VS Code needs to know where it can find each header file referenced in your code. By default, the extension searches the current source directory, its sub-directories, and some platform-specific locations. If a referenced header file can’t be found, VS Code displays a green squiggle underneath each #include directive that references it.
To specify additional include directories to be searched, place your cursor over any #include directive that displays a green squiggle, then click the lightbulb action when it appears. This opens the file c_cpp_properties.json for editing; here you can specify additional include directories for each platform configuration individually by adding more directories to the ‘browse.path’ property.
Search for Symbols
You can search for symbols in the current file or workspace to navigate your code more quickly.
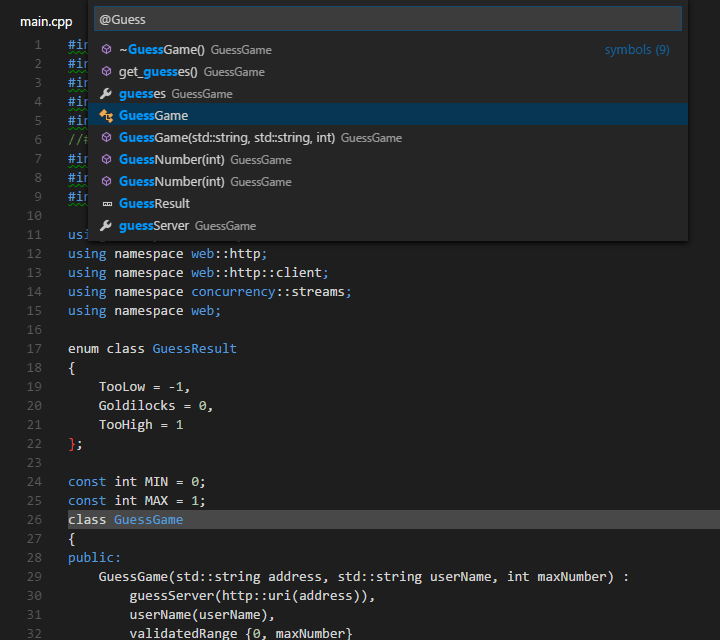
To search for a symbol in the current file, press Ctrl+Shift+O, then enter the name of the symbol you’re looking for. A list of potential matches will appear and be filtered as you type. Choose from the list of matches to navigate to its location.
To search for a symbol in the current workspace, start by pressing Ctrl+T instead, then enter the name of the symbol. A list of potential matches will appear as before. If you choose a match that was found in a file that’s not already open, the file will be opened before navigating to the match’s location.
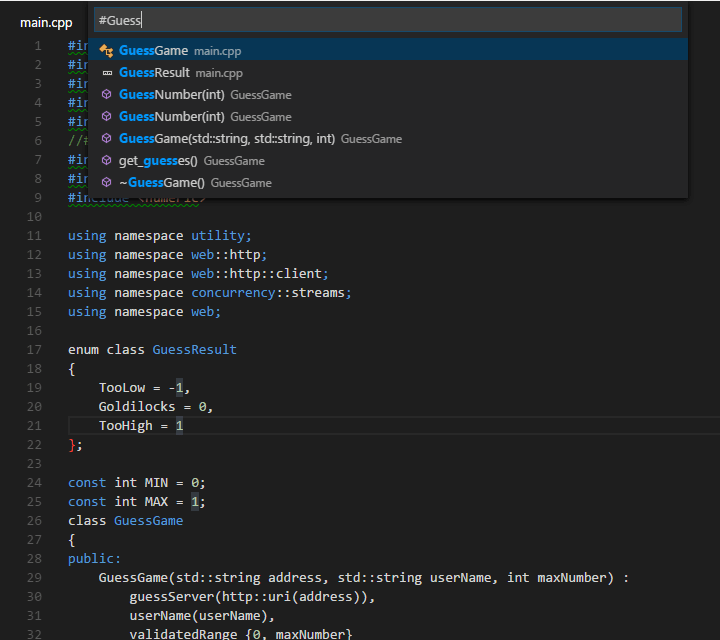
Alternatively, you can search for symbols by accessing these commands through the Command Palette if you prefer. Use Quick Open (Ctrl+P) then enter the ‘@’ command to search the current file, or the ‘#’ command to search the current workspace. Ctrl+Shift+O and Ctrl+T are just shortcuts for the ‘@’ and ‘#’ commands, respectively, so everything works the same.
Peek Definition
You can take a quick look at how a symbol was defined by using the Peek Definition feature. This feature displays a few lines of code near the definition inside a peek window so you can take a look without navigating away from your current location.
To peek at a symbol’s definition, place your cursor on the symbol anywhere it’s used in your source code and then press Alt+F12. Alternatively, you can choose Peek Definition from the context menu (right-click, then choose Peek Definition).
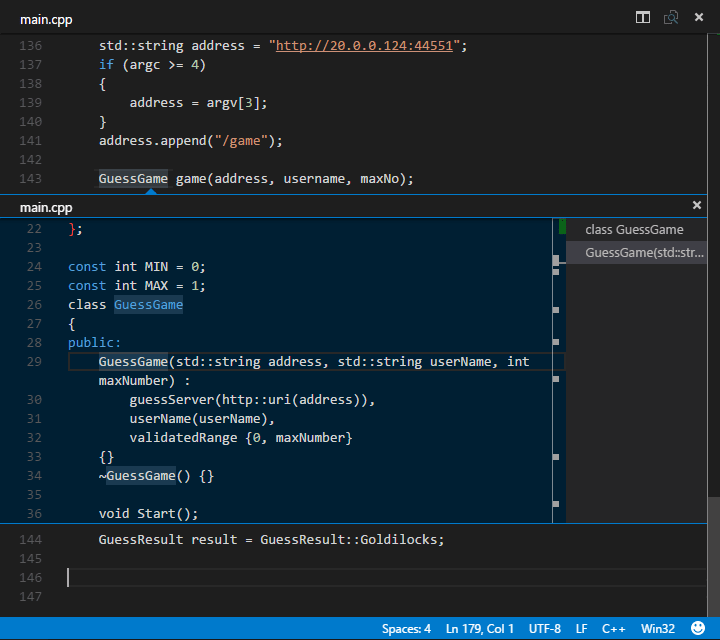
Currently, the C/C++ extension doesn’t parse code in a way that helps it distinguish between competing definitions based on how the symbol is used. These competing definitions arise when the symbol defines different things in different contexts, such as occurs with overloaded functions, classes and their constructors, and other situations. When this happens, each of the competing definitions are listed in the right-hand side of the peek window with the source code of the current selection displayed on the left.
With the peek window open, you browse the list of competing definitions to find the one you’re interested in. If you want to navigate to the location of one of the definitions just double-click the definition you’re interested in, or by double-clicking anywhere in the source code displayed on the left-hand side of the peek window.
Go to Definition
You can also quickly navigate to where a symbol is defined by using the Go to Definition feature.
To go to a symbol’s definition, place your cursor on the symbol anywhere it is used in your source code and then press F12. Alternatively, you can choose Go to Definition from the context menu (right-click, then choose Go to Definition). When there’s only one definition of the symbol, you’ll navigate directly to its location, otherwise the competing definitions are displayed in a peek window as described in the previous section and you have to choose the definition that you want to go to.
Debugging
After you have set up the basics of your debugging environment as specified in Getting Started, you can learn more details about debugging C/C++ in this section.
VS Code supports the following debuggers for C/C++ depending on the operating system you are using:
- Linux: GDB
- macOS: LLDB or GDB
- Windows: the Visual Studio Windows Debugger or GDB (using Cygwin or MinGW)
Windows Debugging with GDB
You can debug Windows applications created using Cygwin or MinGW by using VS Code. To use Cygwin or MinGW debugging features, the debugger path must be set manually in the launch configuration (launch.json). To debug your Cygwin or MinGW application, add the miDebuggerPath property and set its value to the location of the corresponding gdb.exe for your Cygwin or MinGW environment.
For example:
"miDebuggerPath": "c:\\mingw\\bin\\gdb.exe"
Cygwin/MinGW debugging on Windows supports both attach and launch debugging scenarios.
Conditional Breakpoints
Conditional breakpoints enable you to break execution on a particular line of code only when the value of the condition is true. To set a conditional breakpoint, right-click on an existing breakpoint and select Edit Breakpoint. This opens a small peek window where you can enter the condition that must evaluate to true in order for the breakpoint to be hit during debugging.
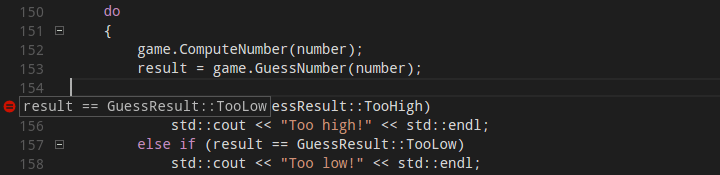
In the editor, conditional breakpoints are indicated by a breakpoint symbol that has a black equals sign inside of it. You can place the cursor over a conditional breakpoint to show its condition.
Function Breakpoints
Function breakpoints enable you to break execution at the beginning of a function instead of on a particular line of code. To set a function breakpoint, on the Debug pane right-click inside the Breakpointssection, then choose Add Function Breakpoint and enter the name of the function on which you want to break execution.
Expression Evaluation
VS Code supports expression evaluation in several contexts:
- You can type an expression into the Watch section of the Debug panel and it will be evaluated each time a breakpoint is hit.
- You can type an expression into the Debug Console and it will be evaluated only once.
- You can evaluate any expression that appears in your code while you’re stopped at a breakpoint.
Note that expressions in the Watch section take effect in the application being debugged; an expression that modifies the value of a variable will modify that variable for the duration of the program.
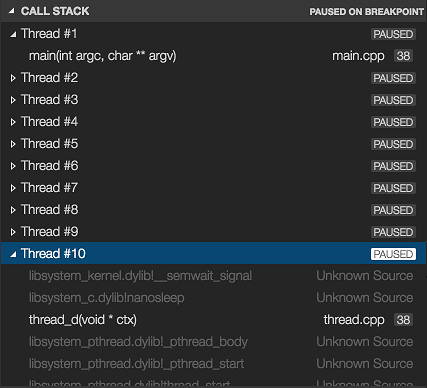
Multi-threaded Debugging
The C/C++ extension for VS Code has the ability to debug multi-threaded programs. All threads and their call stacks appear in the Call Stack section:
Memory Dump Debugging
The C/C++ extension for VS Code also has the ability to debug memory dumps. To debug a memory dump, open your launch.json file and add the coreDumpPath (for GDB or LLDB) or dumpPath (for the Visual Studio Windows Debugger) property to the C++ Launch configuration, set its value to be a string containing the path to the memory dump. This will even work for x86 programs being debugged on an x64 machine.
Additional Symbols
If there are additional directories where the debugger can find symbol files (for example, .pdb files for the Visual Studio Windows Debugger), they can be specified by adding the additionalSOLibSearchPath(for GDB or LLDB) or symbolSearchPath (for the Visual Studio Windows Debugger).
For example:
"additionalSOLibSearchPath": "/path/to/symbols;/another/path/to/symbols"
or
"symbolSearchPath": "C:\\path\\to\\symbols;C:\\another\\path\\to\\symbols"
Locate source files
The source file location can be changed if the source files are not located in the compilation location. This is done by simple replacement pairs added in the sourceFileMap section. The first match in this list will be used.
For example:
"sourceFileMap": {
    "/build/gcc-4.8-fNUjSI/gcc-4.8-4.8.4/build/i686-linux-gnu/libstdc++-v3/include/i686-linux-gnu": "/usr/include/i686-linux-gnu/c++/4.8",
    "/build/gcc-4.8-fNUjSI/gcc-4.8-4.8.4/build/i686-linux-gnu/libstdc++-v3/include": "/usr/include/c++/4.8"
}
GDB, LLDB and MI Commands (GDB/LLDB)
For the C++ (GDB/LLDB) debugging environment, you can execute GDB, LLDB and MI commands directly through the debug console with the -exec command, but be careful, executing commands directly in the debug console is untested and might crash VS Code in some cases.
Other Debugging Features
- Unconditional breakpoints
- Watch window
- Call stack
- Stepping
For more information on debugging with VS Code, see this introduction to debugging in VS Code.
Known Limitations
Symbols and Code Navigation
All platforms:
- Because the extension doesn’t parse function bodies, Peek Definition and Go to Definition don’t work for symbols defined inside the body of a function.
Debugging
Windows:
- GDB on Cygwin and MinGW cannot break a running process. To set a breakpoint when the application is running (not stopped under the debugger), or to pause the application being debugged, press Ctrl-C in the application’s terminal.
- GDB on Cygwin cannot open core dumps.
Linux:
- GDB needs elevated permissions to attach to a process. When using attach to process, you need to provide your password before the debugging session can begin.
macOS:
- LLDB:
- When debugging with LLDB, if the Terminal window is closed while in break mode, debugging does not stop. Debugging can be stopped by pressing the Stop button.
- When debugging is stopped the Terminal window is not closed.
- GDB:
- Additional manual install steps need to be completed to use GDB on macOS. See Manual Installation of GDB for OS X in the README.
- When attaching to a process with GDB, the application being debugged cannot be interrupted. GDB will only bind breakpoints set while the application is not running (either before attaching to the application, or while the application is in a stopped state). This is due to a bug in GDB.
- Core dumps cannot be loaded when debugging with GDB because GDB does not support the core dump format used in macOS.
- When attached to a process with GDB, break-all will end the process.
Next Steps
Read on to find out about:
- Basic Editing – Learn about the powerful VS Code editor.
- Code Navigation – Move quickly through your source code.
- Tasks – use tasks to build your project and more
- Debugging – find out how to use the debugger with your project
Common Questions
Q: My project won’t load.
A: VS Code doesn’t currently support C++ project files, instead it considers a directory of your choosing to be the workspace of your project. Source code files inside that directory and its sub-directories are part of the workspace.
Q: How do I build/run my project?
A: VS Code supports tasks that you can configure to build your application, and natively understands the output of MSBuild, CSC, and XBuild. For more information, see the Tasks documentation.
If you have any other questions or run into any issues, please file an issue on GitHub.